Map data
In addition to RES data, further map data are required for mapping RES features with geoinformation. EEDATEN uses map data from Bundesamt für Kartographie und Geodäsie in combination with open-source JavaScript library Leaflet to display RES features in interactive maps. To perform geomapping and analysis locally, Python offers useful packages and mappings tools what is shown in the following example.
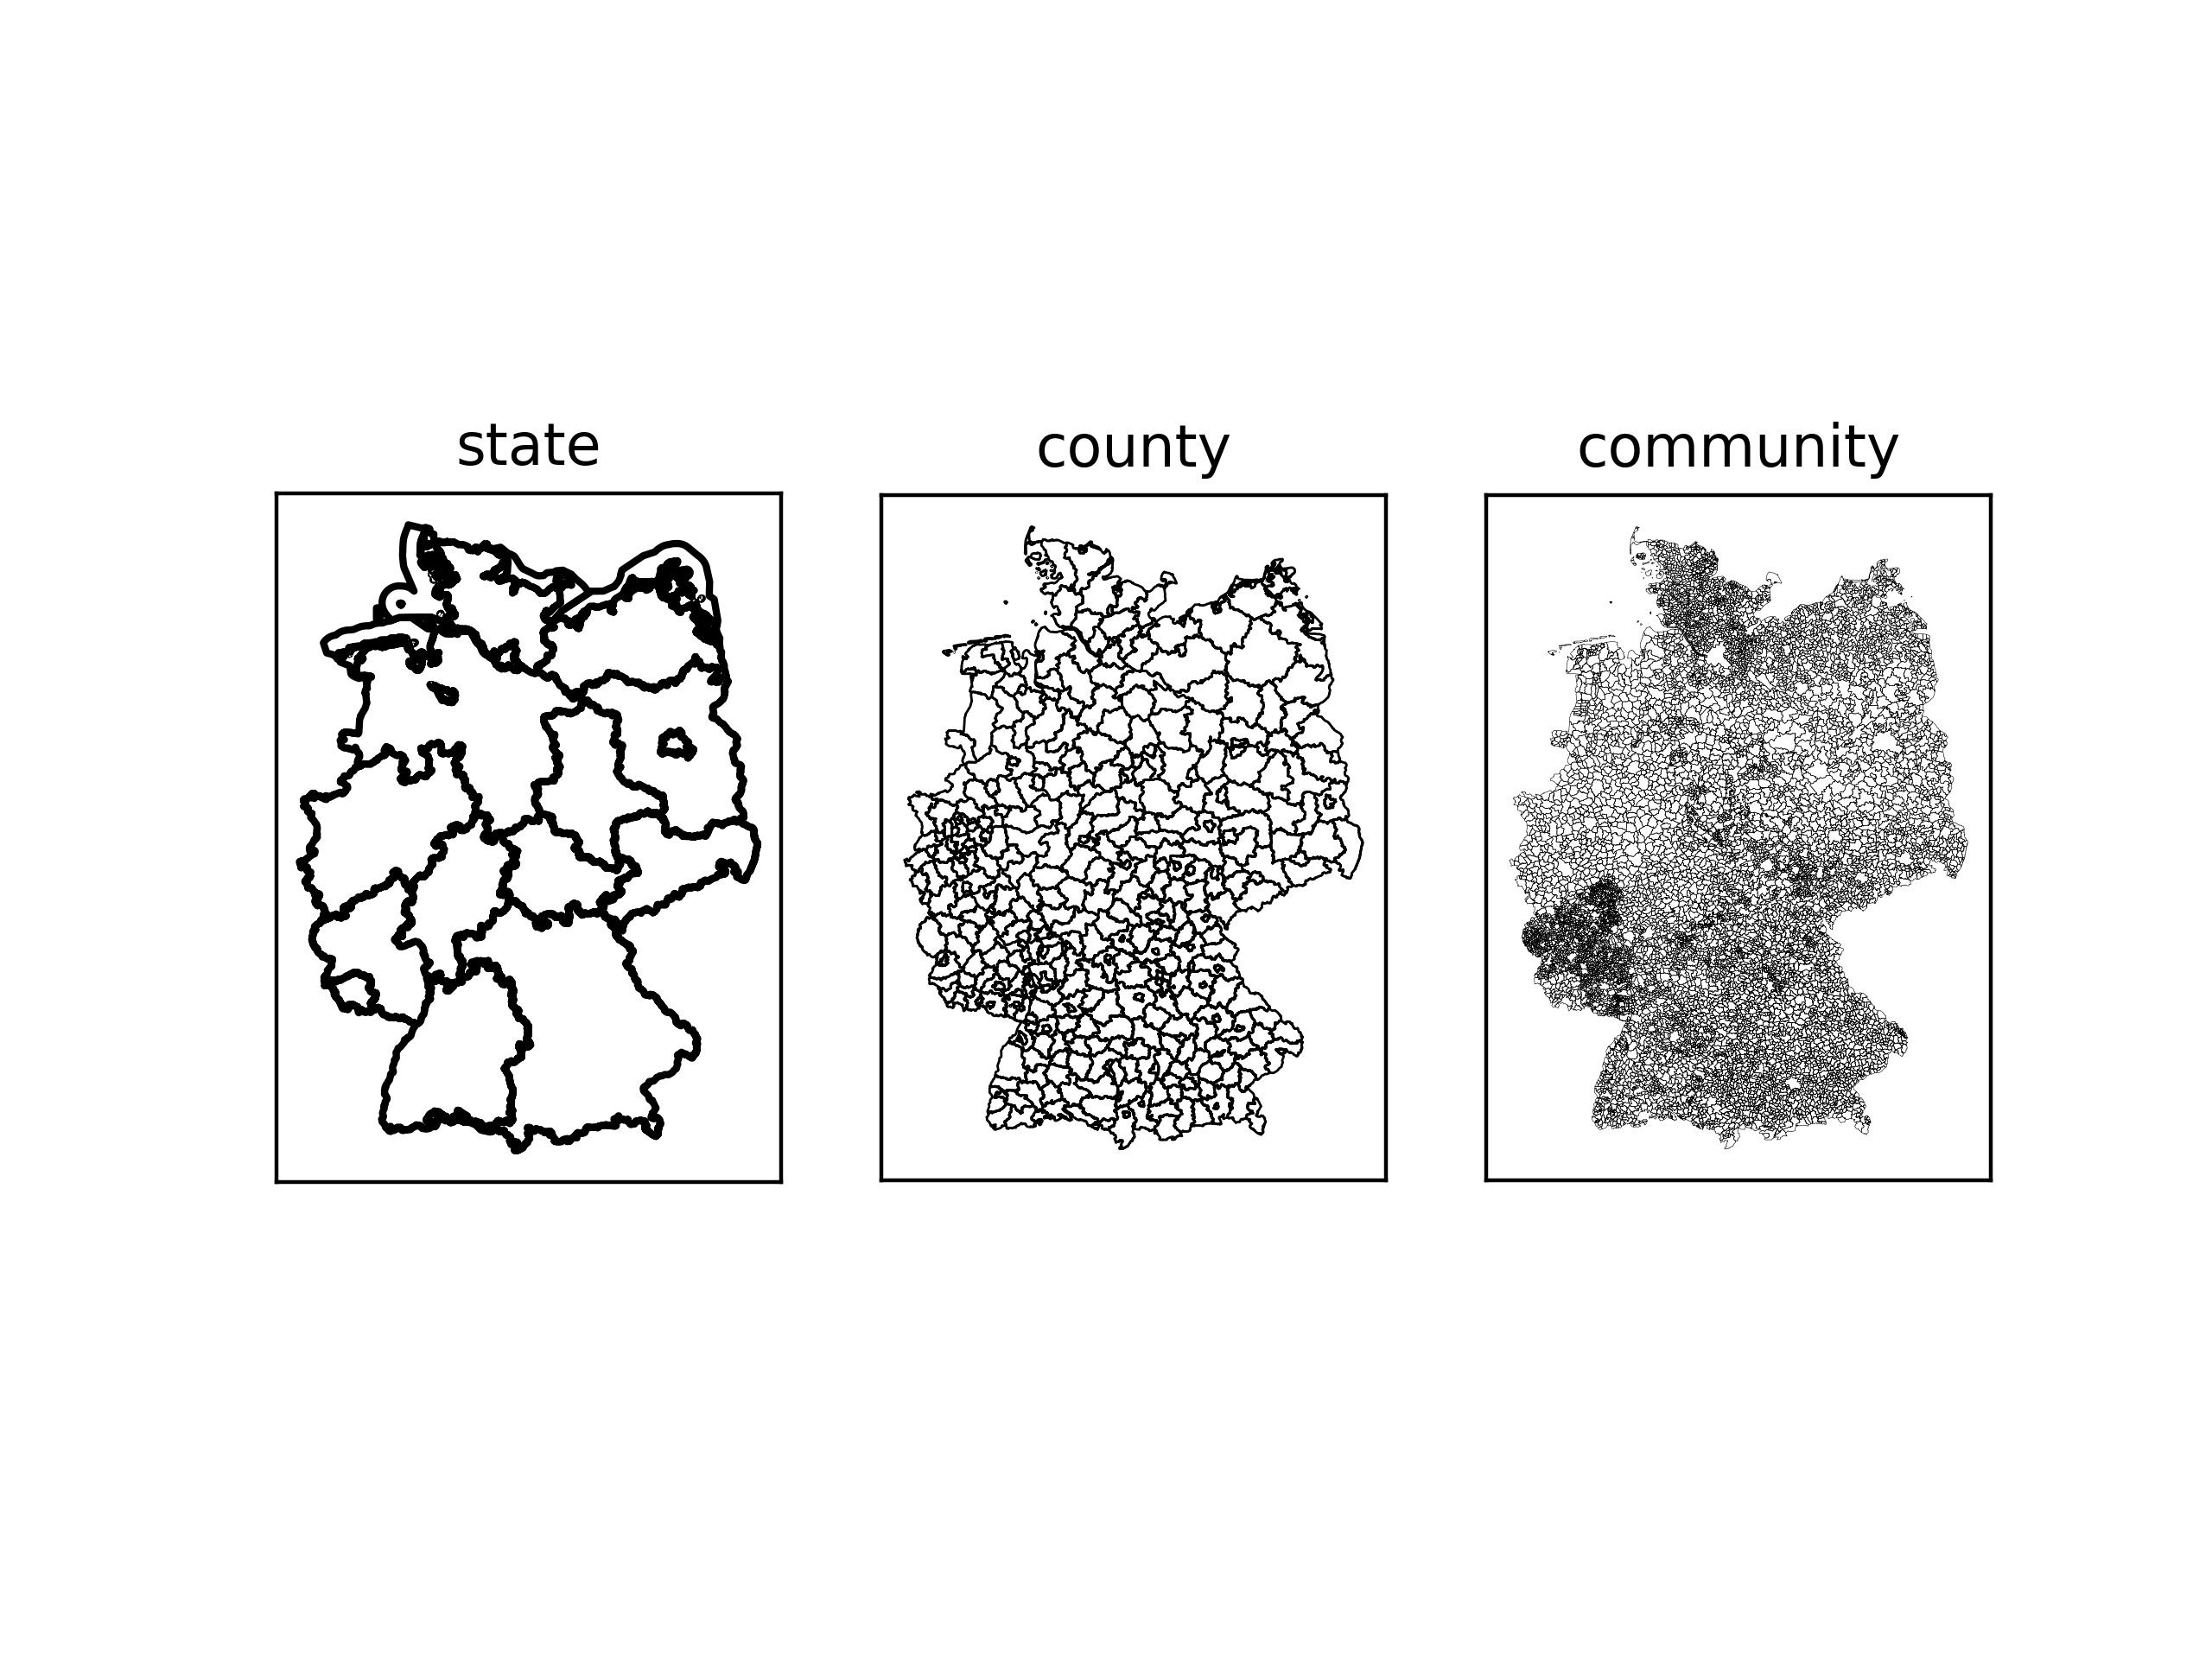
Let’s create some simple maps of Germany with different administration levels:
import geopandas as gpd
import matplotlib.pyplot as plt

# read shapefile (.shp) or .geojson with administration level state, county and community
gdf_state = gpd.read_file("/path/to/.shp")
gdf_county= gpd.read_file("/path/to/.shp")
gdf_community= gpd.read_file("/path/to/.shp")

fig, (ax1, ax2, ax3) = plt.subplots(nrows=1, ncols=3)

# print boundary
ax1 = gdf_state.boundary.plot(ax=ax1, edgecolor="black")
ax1.set_title("state")
ax1.get_xaxis().set_visible(False)
ax1.get_yaxis().set_visible(False)

ax2 = gdf_county.boundary.plot(ax=ax2, edgecolor="black", linewidth=0.5)
ax2.set_title("county")
ax2.get_xaxis().set_visible(False)
ax2.get_yaxis().set_visible(False)

ax3 = gdf_community.boundary.plot(ax=ax3, edgecolor="black", linewidth=0.1)
ax3.set_title("community")
ax3.get_xaxis().set_visible(False)
ax3.get_yaxis().set_visible(False)
plt.show()
As result we get three subplots where boundaries of each administration level are displayed. The above mentioned map data in shapefile format use EPSG:31467 (European Petroleum Survey Group Geodesy) as projection method. For example, OpenStreetMap bases on EPSG:3857.
Different administration levels form the basis for geomapping. On the following pages geomapping is referred to assign RES features to spatial data (map data) introduced in this section.